CLIPscore (and ProTrekscore)
After learning about FID, I got pretty excited about using an equivalent metric for protein sequences using protein language model embeddings. Since I’ve always wanted to create a Python package and publish it on PyPI, I figured a pLM-FID calculator would be a good, simple first project.
It’s currently in the works and a separate post about the lessons learned from this mini-project is on the way. I’m almost done but needed a mental break before writing the tests. So let’s go over CLIPscore, another metric from the image generation world.
what’s the purpose of CLIPscore?
CLIPscore (CLIP-S) is introduced by the paper: “CLIPScore: A Reference-free Evaluation Metric for Image Captioning. The primary use case was to evaluate image captions generated by DL-models. Previous metrics relied on reference-text to evaluate generated captions.
But as the authors write:
Should we need references for the evaluation of image captions? After all, when humans assess the appropriateness of an image caption, we do so just by looking at the image and reading the candidate’s text.
CLIP-S addresses this by only requiring two inputs: an image and its corresponding caption1.
computing CLIPscore
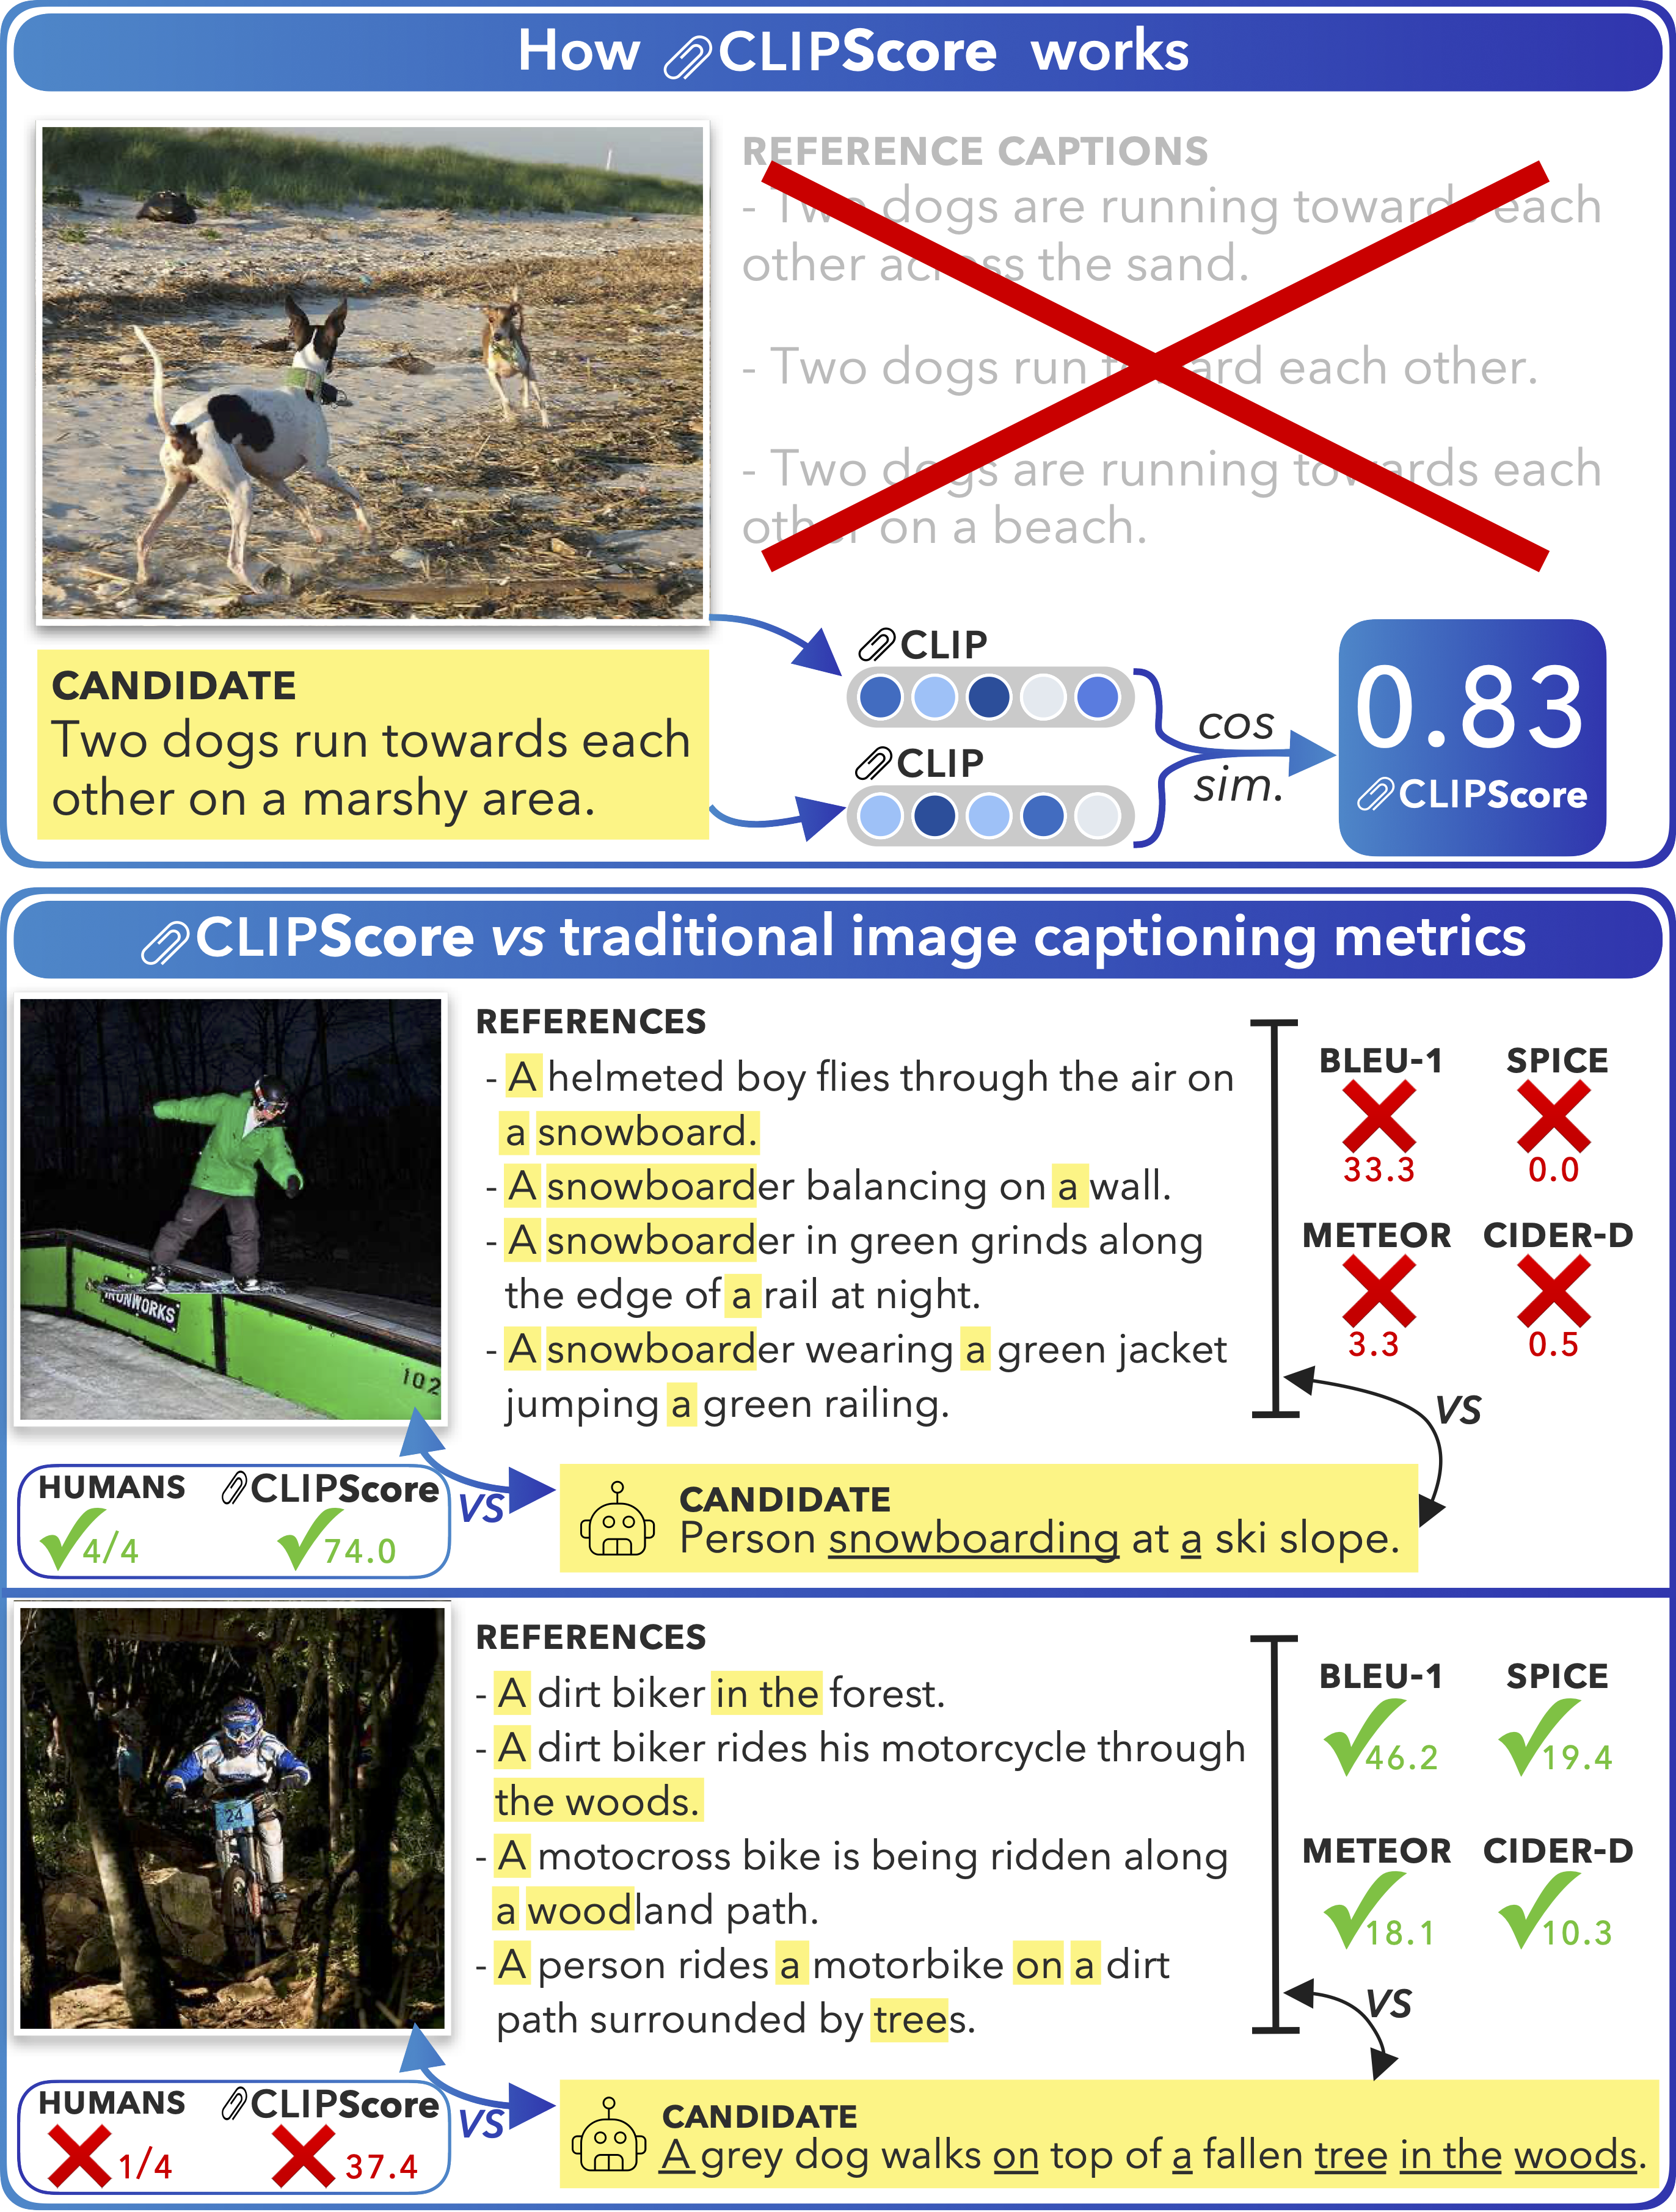
As the name suggests, CLIP-S relies on CLIP2. Saving the discussion on CLIP for later, CLIP is trained to align the representations of paired images and texts in the latent space.
CLIP’s image and corresponding text representations are semantically aligned, meaning that an image of cat and the word cat will be close together in the latent space. During inference, CLIP can take in an image and a text sequence and output a corresponding feature representation for both.
Then, the intuition behind CLIP-S becomes very straightforward–if a generated caption accurately captures the content of the image, the CLIP-embedding of the image and the caption should be similar. Given CLIP’s fixed-dimension output embeddings, we can simply compute similarity using cosine similarity.
The formula to compute CLIP-S is as follows:
\[\texttt{CLIP-s}(\mathbf{c}, \mathbf{v}) = w * \max (\cos(\mathbf{c},\mathbf{v}), 0)\]\(\mathbf{c}\) and \(\mathbf{v}\) represent the textual CLIP embedding and the visual CLIP embedding, respectively. \(w\) is just a scaling factor3. The higher the CLIPscore, the better the caption (roughly speaking).
ProTrek-S
The idea behind CLIP-S makes a lot sense, and it led me to wonder if something similar is used for protein design. From a biologist’s perspective, unconditional protein generation is not that exciting. We care specifically about conditional generation, producing sequences that satisfy specific functional constraints, such as binding to a target or catalyzing a reaction.
So a question is how to evaluate conditionally generated proteins. If we were to use FID, as discussed in the previous post, we might use a reference set of all the proteins that we know carry out the desired function. And then we can compare against our set of generated proteins that should, and ideally, we should get a small FID.
Another direction is to directly measure how well the protein captures the functional semantics. Imagine we had labeled pairs of protein sequence and their textual function description. If we had a protein–text model analogous to CLIP, we could embed a protein sequence and a corresponding function description into a shared space and assess their similarity.
Well luckily for us, we have ProTrek4, a tri-modal model, aligning protein sequence, structure, and function. If we ignore the structure part for now–we have a CLIP-equivalent for protein sequences. Now given some generated proteins and their desired functions, we can calculate its ProTrek-S (same equation as CLIP-S, just switch the embedding model).
In CLIP-S, the caption is evaluated, given an image. In ProTrek-S, we have the inverse: given a desired function, we evaluate a generated protein for how well it reflects that function. This can be especially useful as a metric as validating a protein’s function experimentally is both expensive and time-consuming5. ProTrek-S is introduced the Pinal6 paper and I think it’s a great idea.
conclusion
As the authors of CLIP-S point out, a limitation is underlying biases of the pre-training dataset. I’m sure this is even more relevant in the protein domain, as the available sequence-text pairs is relatively limited compared to image-text pairs. Another consideration is how to actually write and format our desired function in natural language.
Still, learning about evaluation metrics from the field of image generation has been very fun. While there are many parallels that we can adopt for protein generation, I am also thinking more about what domain-specific modifications we can apply for a more meaningful metric.
-
I’m sorry, how did 1/4 people think the bottom image showed a “grey dog”? ↩
-
Learning Transferable Visual Models From Natural Language Supervision ↩
-
While the cosine similarity has a range of \([-1,1]\), the empirical range observed by the authors is \([0,0.4]\). The authors recommended \(w=2.5\) to re-scale the range to \([0,1]\). ↩
-
ProTrek: Navigating the Protein Universe through Tri-Modal Contrastive Learning ↩
-
Actually, there are high-throughput assays to screen for function, but these are still limited by the fact that you can’t automate the process, unlike CLIP-S and ProTrek-S. ↩